In higher eukaryotic organisms, like humans, RNA transcripts from the vast majority of genes are alternatively spliced. Alternative splicing dramatically increases the protein-coding potential of eukaryotic genomes and its regulation is often specific to a given tissue or developmental stage.
Using our updated Iso-Seq™ sample preparation protocol, we have generated a dataset containing the full-length whole transcriptome from three diverse human tissues (brain, heart, and liver). The updated version of the Iso-Seq method incorporates the use of a new PCR polymerase that improves the representation of larger transcripts, enabling sequencing of cDNAs of nearly 10 kb in length. The inclusion of multiple sample types makes this dataset ideal for exploring differential alternative splicing events. Download the polished, full-length transcript sequences and the raw data files.
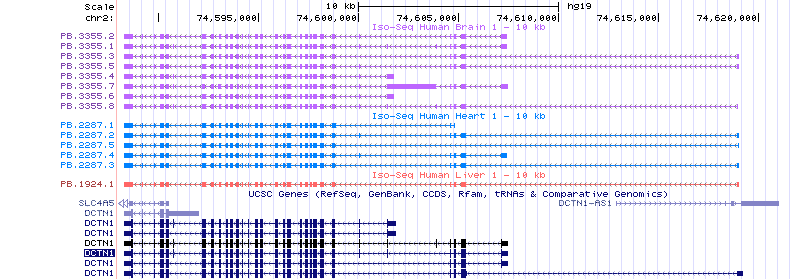
We have also uploaded the polished, full-length, non-redundant transcript set onto the UCSC Genome Browser to enable browsing of the data. An example of the data is shown below in Figure 2. Access the genome browser tracks.
Materials and Methods
Human mRNA samples were purchased from Biochain. Amplified double-stranded cDNA was generated as outlined in the updated version of the Iso-Seq target preparation protocol. The distribution of cDNA sizes was determined by running the amplified cDNA on a Bioanalyzer (Figure 1). The amplified cDNA was size fractionated on a BluePippin™ system (Sage Science). Size fractions of 1-2 kb, 2-3 kb, 3-6 kb, and 5-10 kb were collected, purified, and subjected to an additional round of PCR amplification. The 5-10 kb fraction was not collected for the liver sample because there were insufficient transcripts of ≥ 5 kb (Figure 1).
SMRTbell™ libraries were generated from each size fraction and sequenced independently. SMRTbell templates from the 3-6 kb and 5-10 kb fractions were cleaned up using the BluePippin system. The libraries were sequenced with a combination of P4-C2 and P5-C3 sequencing chemistries on a PacBio RS II with 2- or 3-hour movies. After sequencing, the data was processed using the “RS_IsoSeq.1” analysis pipeline with SMRT® Portal version 2.2. A summary of the sequencing results is shown in Table 1.
Table 1: Summary of Sequencing Results
General sequencing statistics for each sample/size bin combination are shown along with statistics for each tissue.
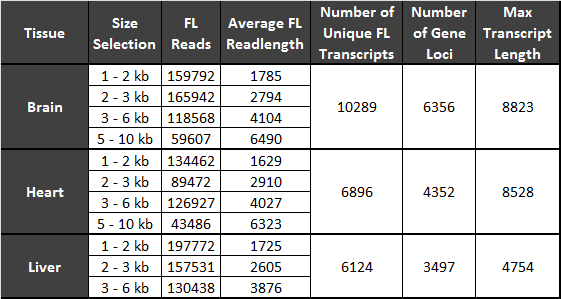
Figure 1: Size Distribution of Amplified cDNA
Approximately 50 ng of amplified cDNA from each tissue was run on an Agilent Bioanalzyer DNA 7500 kit. The plot shows the electropherogram with each tissue color coded.
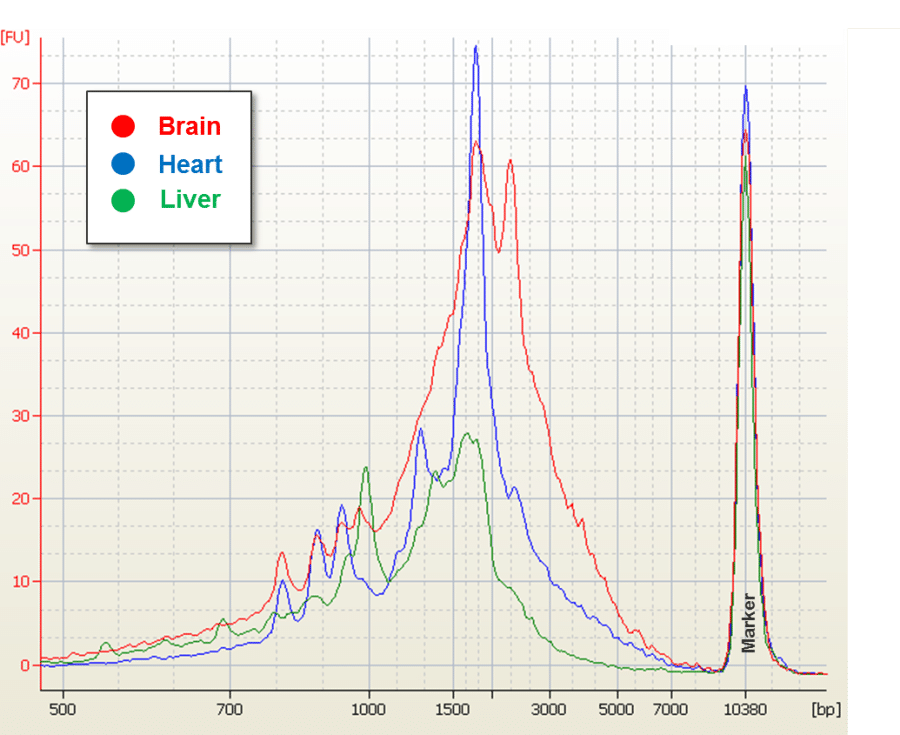
Figure 2: UCSC Genome Browser Screen Shot
Example data for the DCTN1 gene as shown in the UCSC Genome Browser. Polished, non-redundant, full-length transcript sequences are shown for each tissue.